
§ contents
TL;DR: A minimal Hono + Postgres URL shortener with two endpoints and Swagger UI. This post establishes the baseline latency you’ll use as a reference point throughout the series.
Have you ever been in an interview and they asked you, “Design a URL shortener.”
That’s it. That’s the question. What was your answer? Was it anything like mine, which was just “two endpoints — one to shorten, one to redirect, and that’s it! Can I have a job now?”
There’s a reason this is a classic interview question. It’s not a trick question, but it is a weeder question. Many developers may fall into the trap of not understanding how complex a URL shortener actually could be. It’s easy to think that it’s just two endpoints and a single database table and that’s all we need. What happens when there’s a million requests per day against your API? Will your 1 vCPU VPS be able to handle it, or will you just keep adding more RAM and vCPU?
The goal of this series is to learn infrastructure concepts hands-on — not by following a curriculum, but by building something real and breaking it. A URL shortener is the perfect vehicle: it’s trivial enough to understand in five minutes, and interesting enough to keep adding layers to.
This first post covers the foundation. No Redis, no load balancers, nothing clever. Just the app itself, and a baseline p95 you’ll reference as we add Redis, load balancers, and more.
If you want to follow along, the repo can be found here.
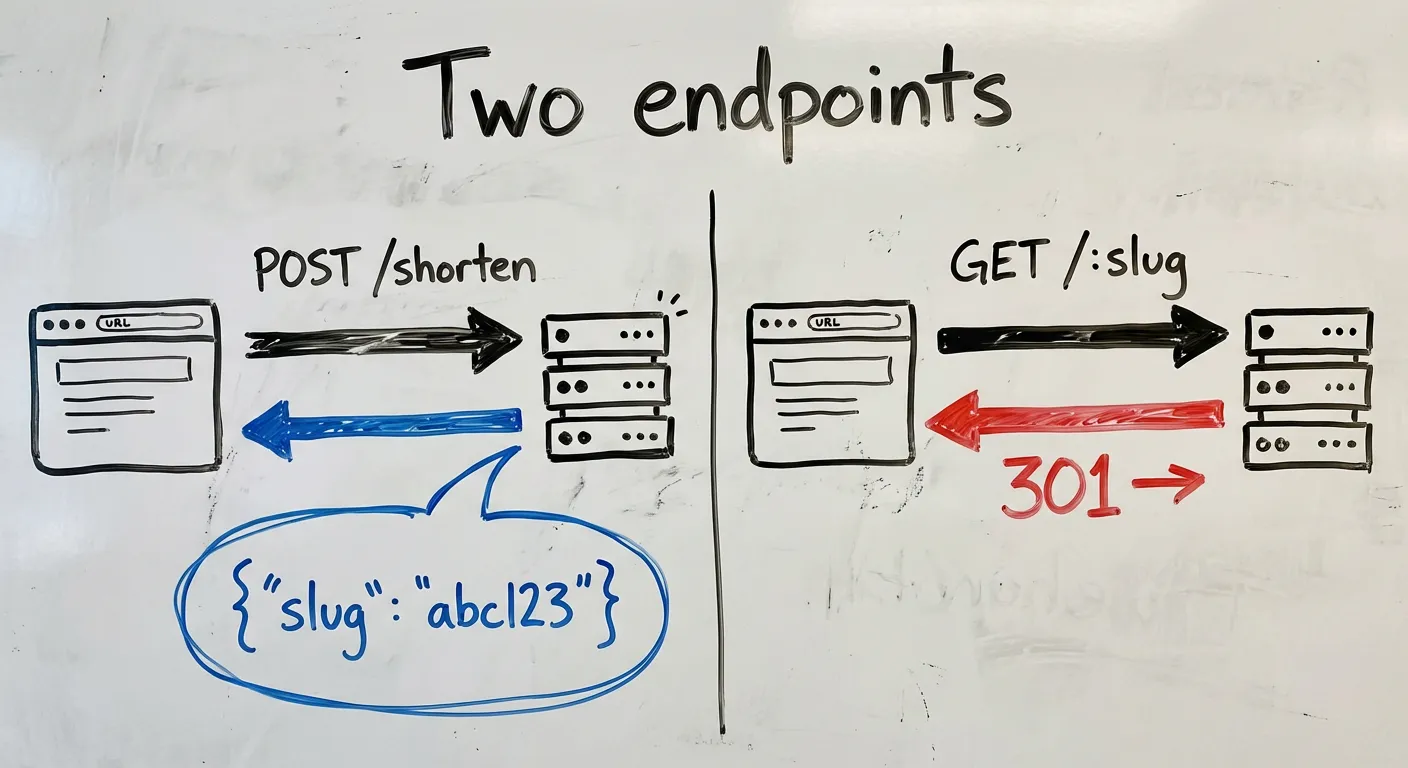
The app in two endpoints
POST /shorten   — takes a URL, returns a slug
GET  /:slug     — looks up the slug, redirects to the original URL
That’s it. Everything in this series is about making these two endpoints faster, more resilient, and more observable. Keeping the app trivial is a feature — it means every new concept gets your full attention.
Why Hono
I didn’t want to think too much about the stack because the app isn’t the point. So, I went with the simplest serverside framework that gives me OpenAPI specs: Hono. Hono is a small, fast web framework that runs on any JS runtime — Node, Bun, Cloudflare Workers, Deno. For this project, it has two things I care about:
- First-class TypeScript — no ceremony, no workarounds
@hono/zod-openapi— schema validation and OpenAPI spec generation from the same source
That second point matters a lot, which I’ll get to in a moment.
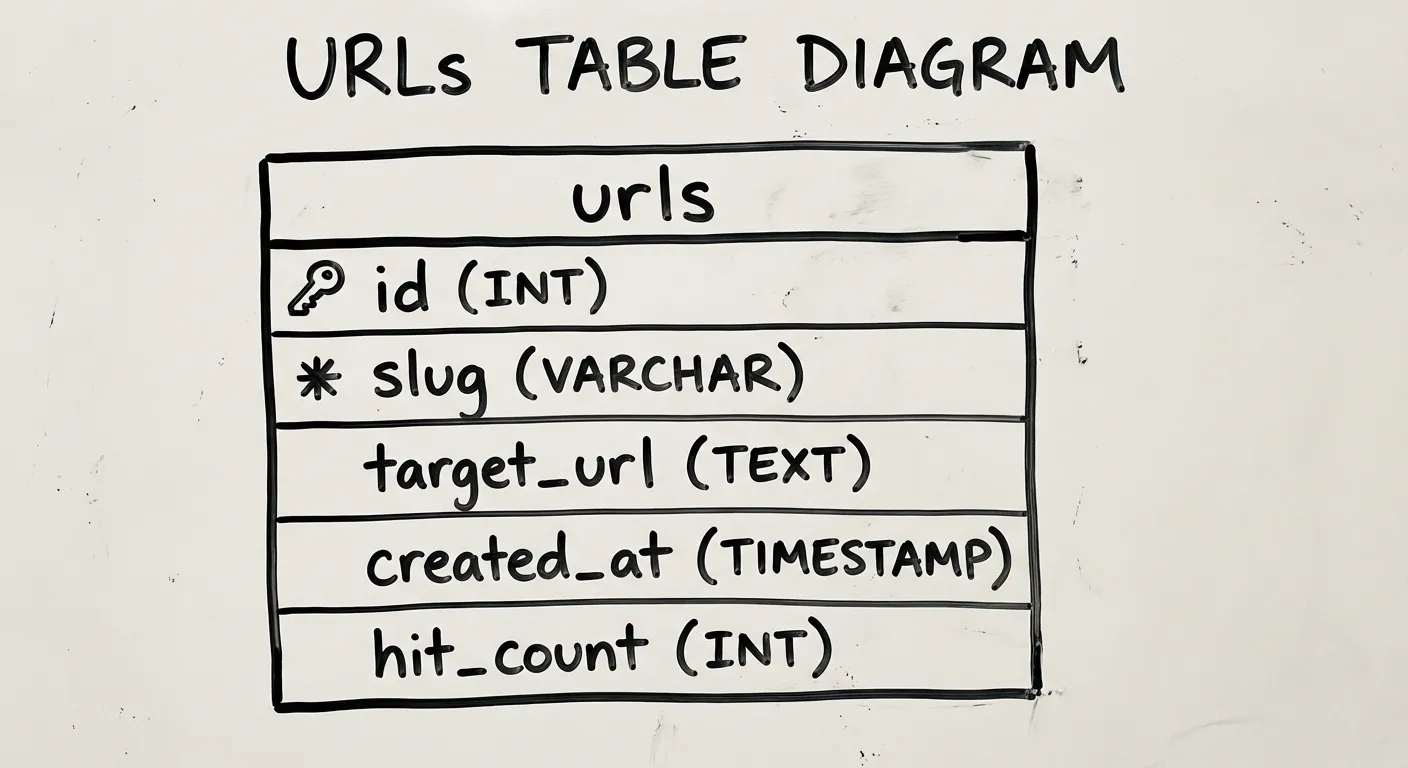
Schema design
The database has one table, codified here as a drizzle schema:
import { pgTable, serial, text, timestamp, integer, index } from 'drizzle-orm/pg-core'

export const urls = pgTable('urls', {
  id: serial('id').primaryKey(),
  slug: text('slug').notNull().unique(),
  originalUrl: text('original_url').notNull(),
  createdAt: timestamp('created_at').defaultNow().notNull(),
  hitCount: integer('hit_count').default(0).notNull(),
}, (table) => [
  index('slug_idx').on(table.slug),
])
I think the columns are pretty self-explanatory, but let’s talk about hitCount for a second. hitCount just represents how often people are hitting this link. We’ll talk a bit more about this column in the implementation section.
One other decision worth noting: slug has a UNIQUE constraint, so the database enforces no collisions. The application layer doesn’t need to worry about it.
Slug generation: three approaches
There are three common ways to generate slugs, each with different tradeoffs:
| Approach | Example | Pros | Cons |
|---|---|---|---|
| Random (nanoid) | gV5kXp | No coordination needed, unpredictable | Slightly longer for the same collision resistance |
| Hash of URL | sha256(url)[:7] | Deterministic — same URL, same slug | Hash collisions require handling; leaks URL structure |
| Sequential | 0001, 0002 | Short, predictable length | Requires coordination; enumerable (privacy concern) |
I went with nanoid (random). Sequential is a privacy concern — if someone gives you a short URL ending in 00100, you can probably enumerate 00001-00099. Not ideal. Hash vs random was a toss-up, but random had fewer downsides. The right choice depends on whether leaking the URL structure is fine or not.
A 7-character slug from a 36-character alphabet (a-z and 0-9) gives you ~78 billion possible combinations. At a million slugs created per day, you’d expect your first collision after roughly 200 years. This is why observability is important — if a collision does happen, you need to know when and how frequently, and at that point you can reassess whether you want to keep with random or go with hashing, or use a long random slug. An 8-character slug gives us 2.8 trillion combos. We’ll use nanoid 8 in this post, but nanoid 7 would suffice as well.
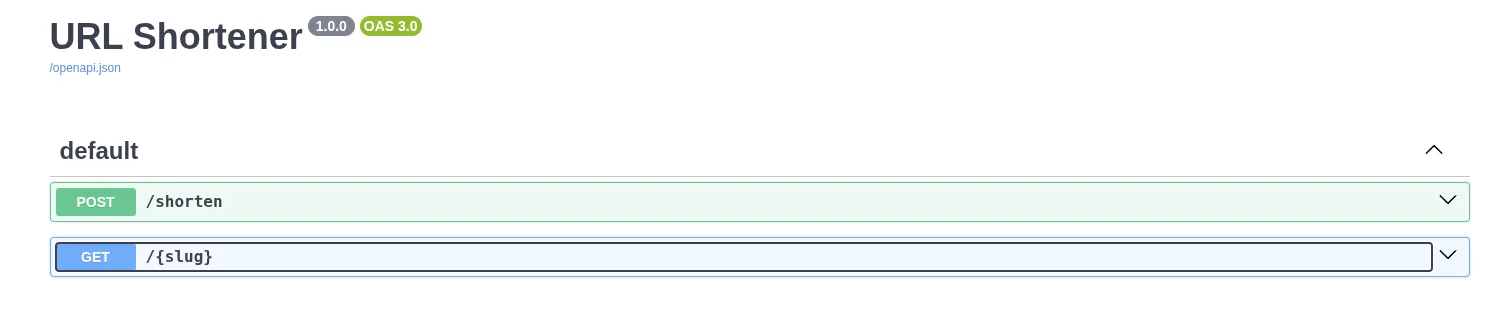
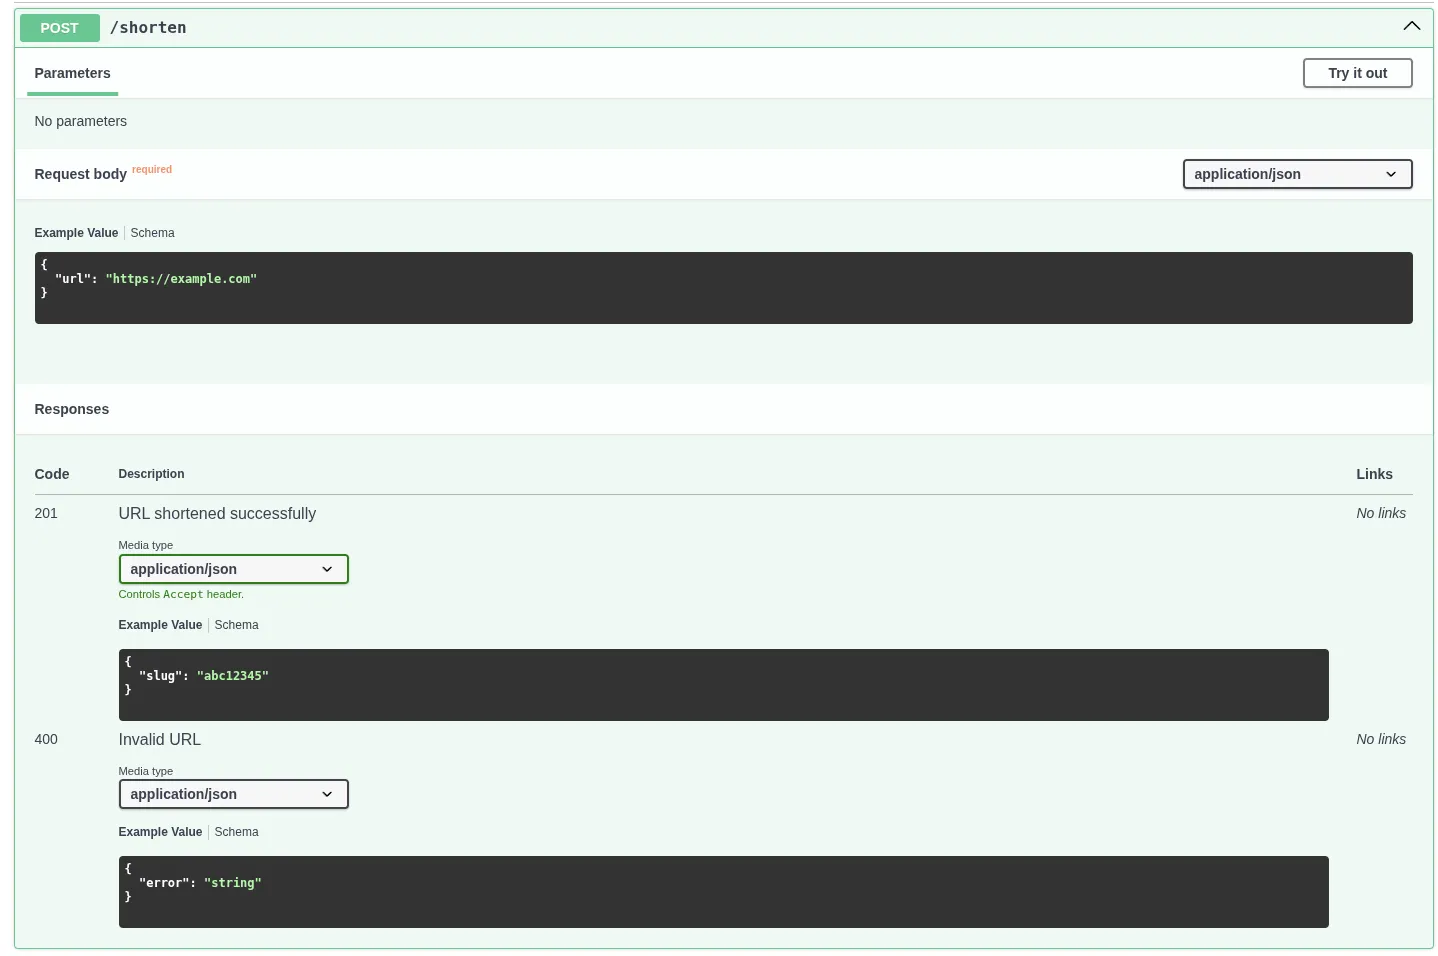
OpenAPI as documentation-as-code
@hono/zod-openapi lets you define your request/response schemas once, and get two things for free: runtime validation and an OpenAPI spec. The Swagger UI at /docs becomes your interactive frontend, no separate frontend needed.
const shortenRoute = createRoute({
  method: 'post',
  path: '/shorten',
  request: {
    body: {
      content: {
        'application/json': {
          schema: z.object({ url: z.string().url() }),
        },
      },
    },
  },
  responses: {
    201: {
      content: {
        'application/json': {
          schema: z.object({ slug: z.string() }),
        },
      },
      description: 'URL shortened successfully',
    },
  },
});
I’ve always appreciated when API providers provide some sort of interactive playground. I can see the schema of inputs and outputs and run tests without touching my code. The result is a clean way to see all of your app’s endpoints, and you can add whatever additional information necessary for your users, like when to use it, whether it’s deprecated (and what to use instead), or any auth requirements, giving us a clean, self-documenting view of every endpoint.
The full endpoints
Here’s the full implementation of the URL shortener. The only non-obvious decision is in redirect.ts: hit count tracking is fire-and-forget, so a slow or failed counter update never delays the redirect. This is fine for our low-scale demo as a baseline, because the redirect matters more than the counter.
The /redirect endpoint:
import { createRoute, z } from '@hono/zod-openapi'
import { OpenAPIHono } from '@hono/zod-openapi'
import { eq, sql } from 'drizzle-orm'
import { db } from '../db'
import { urls } from '../db/schema'

const SlugParamSchema = z.object({
  slug: z.string().openapi({ example: 'abc12345' }),
})

const ErrorSchema = z.object({
  error: z.string(),
})

const redirectRoute = createRoute({
  method: 'get',
  path: '/{slug}',
  request: {
    params: SlugParamSchema,
  },
  responses: {
    301: {
      description: 'Redirect to the original URL',
    },
    404: {
      content: { 'application/json': { schema: ErrorSchema } },
      description: 'Slug not found',
    },
  },
})

export const redirectRouter = new OpenAPIHono()

redirectRouter.openapi(redirectRoute, async (c) => {
  const { slug } = c.req.valid('param')

  const result = await db
    .select()
    .from(urls)
    .where(eq(urls.slug, slug))
    .limit(1)

  if (result.length === 0) {
    return c.json({ error: 'Slug not found' }, 404)
  }

  // Fire-and-forget: increment hit count without blocking the redirect
  db.update(urls)
    .set({ hitCount: sql`${urls.hitCount} + 1` })
    .where(eq(urls.slug, slug))
    .execute()
    .catch(() => {}) // swallow errors — redirect is more important than the counter

  return c.redirect(result[0].originalUrl, 301)
})
The /shorten endpoint is a lot simpler. No fire-and-forget, just insert the record and return the slug.
import { createRoute, z } from '@hono/zod-openapi'
import { OpenAPIHono } from '@hono/zod-openapi'
import { nanoid } from 'nanoid'
import { db } from '../db'
import { urls } from '../db/schema'

const ShortenBodySchema = z.object({
  url: z.string().url().openapi({ example: 'https://example.com' }),
})

const ShortenResponseSchema = z.object({
  slug: z.string().openapi({ example: 'abc12345' }),
})

const ErrorSchema = z.object({
  error: z.string(),
})

const shortenRoute = createRoute({
  method: 'post',
  path: '/shorten',
  request: {
    body: {
      content: { 'application/json': { schema: ShortenBodySchema } },
      required: true,
    },
  },
  responses: {
    201: {
      content: { 'application/json': { schema: ShortenResponseSchema } },
      description: 'URL shortened successfully',
    },
    400: {
      content: { 'application/json': { schema: ErrorSchema } },
      description: 'Invalid URL',
    },
  },
})

export const shortenRouter = new OpenAPIHono()

shortenRouter.openapi(shortenRoute, async (c) => {
  const { url } = c.req.valid('json')
  const slug = nanoid(8)

  await db.insert(urls).values({ slug, originalUrl: url })

  return c.json({ slug }, 201)
})
That’s it. This app is intentionally simple because the complexity isn’t in the code, it’s what happens when it runs at scale, and that is what the rest of this series is going to take you through.
Deployment: single VPS behind Caddy
The deployment is intentionally simple: one Hetzner VPS, Caddy as a reverse proxy. Caddy handles TLS automatically. The app runs in a Docker container.
I’m using a 4vCPU and 8GB RAM Ubuntu box in a Helsinki datacenter ($5.99/mo) because that’s just what I use for all my labs, but you probably don’t even need that much; try it with the smallest you can get. If it doesn’t work then you can always rescale.
We’ll be using docker compose to manage services. My docker-compose.yml looks like this:
services:
  postgres:
    image: postgres:16
    container_name: postgres
    environment:
      POSTGRES_USER: ${POSTGRES_USER:-postgres}
      POSTGRES_PASSWORD: ${POSTGRES_PASSWORD}
      POSTGRES_DB: ${POSTGRES_DB:-urlshortener}
    command:
      - "-c"
      - "shared_preload_libraries=pg_stat_statements"
      - "-c"
      - "pg_stat_statements.track=all"
      - "-c"
      - "pg_stat_statements.max=10000"
      - "-c"
      - "track_io_timing=on"
    volumes:
      - ./db-metadata-postgres/data:/var/lib/postgresql/data
      - ./db-metadata-postgres/backups:/backups
    healthcheck:
      test: ["CMD-SHELL", "pg_isready -U ${POSTGRES_USER:-postgres}"]
      interval: 10s
      timeout: 5s
      retries: 5
      start_period: 10s
    restart: unless-stopped

  url-shortener:
    image: ghcr.io/abustamam/url-shortener2:latest
    container_name: url-shortener
    environment:
      DATABASE_URL: postgresql://${POSTGRES_USER:-postgres}:${POSTGRES_PASSWORD}@postgres:5432/urlshortener
      PORT: 8082
    ports:
      - "8082:8082"
    depends_on:
      postgres:
        condition: service_healthy
    restart: unless-stopped

  caddy:
    image: caddy
    container_name: caddy
    ports:
      - "80:80"
      - "443:443"
    volumes:
      - ./Caddyfile:/etc/caddy/Caddyfile
      - ./caddy/data:/data
    depends_on:
      - url-shortener
    restart: unless-stopped

networks:
  default:
    name: srv-network
Use a .env to populate POSTGRES_USER, POSTGRES_PASSWORD, POSTGRES_DB if you want to change from the defaults.
My Caddyfile looks like this:
shrtn.bustamam.tech {
    reverse_proxy url-shortener:8082
}
A single-node setup is exactly right for Phase 1. It makes the baseline latency measurement meaningful — there’s no load balancer, no network hops between services, nothing to confuse the numbers.
Measuring the baseline
Before doing anything else, let’s measure redirect latency. These will be referenced in every subsequent phase, and every optimization will be compared against these values.
We’ll get our baseline values by load-testing our app in order to get a bunch of latency values, then do some math to determine statistical latencies. These are commonly called p50, p90, p95, p99. In pn, we are just talking about the nth percentile. This may sound like jargon, but it’s just statistics, and fortunately, the math is simple. To get these numbers, we sort, then grab the value at the specified rank. So if we say p50, we look at the number that is at the 50% mark. Half of all entries will be lower, half will be higher. If we say p99, we are looking at the highest 1% of latencies, and this is where we typically want to spend our time optimizing as we scale. 1% of 100 is only 1, but 1% of 100,000 is 1,000. Those are real users who may be having real problems with your app.
I’m going to use k6 because it natively outputs p50/p95/p99 in its summary, and it’s scriptable in JS. There are plenty of other tools you could use, feel free to experiment.
I wrote this script:
/**
 * k6 load test for the URL shortener.
 *
 * Usage:
 *   k6 run --env BASE_URL=https://yourdomain.com --env SLUG=abc123 scripts/load-test.js
 *
 * Optional env vars:
 *   VUS       — number of virtual users (default: 50)
 *   DURATION  — test duration (default: 30s)
 *
 * At the end of the run k6 prints a summary including p50/p95/p99 for
 * http_req_duration. Copy those numbers into your blog post / phase notes.
 */

import http from 'k6/http';
import { check } from 'k6';

const BASE_URL = __ENV.BASE_URL || 'http://localhost:3000';
const SLUG = __ENV.SLUG;

if (!SLUG) {
  throw new Error('Set --env SLUG=<your-slug> before running');
}

export const options = {
  vus: parseInt(__ENV.VUS || '50', 10),
  duration: __ENV.DURATION || '30s',
  summaryTrendStats: ['avg', 'min', 'med', 'max', 'p(90)', 'p(95)', 'p(99)'],
};

export default function () {
  const res = http.get(`${BASE_URL}/${SLUG}`, { redirects: 0 });
  check(res, { 'status is 301 or 302': (r) => r.status === 301 || r.status === 302 });
}
vus represents “virtual users.” This script will simulate 50 parallel “users” continuously looping through the default function exported here for the full 30 seconds. Each VU will make one request, and make another as soon as it receives a response.
Install k6 on your machine using the appropriate instructions from here.
Create a test slug via the /shorten endpoint, make note of the slug.
Then run:
k6 run --env BASE_URL="https://shrtn.your.domain" --env SLUG="your_slug" scripts/k6-baseline.jsYou’ll see a lot of stuff here. But you’ll want to pay attention to http_req_duration because it represents the time from sending the request to receiving the response. iteration_duration includes any overhead around the request like setting up k6 on each iteration.

| Percentile | Latency |
|---|---|
| p50 (med) | 172.14ms |
| p95 | 176.86ms |
| p99 | 190.77ms |
The distribution is pretty tight! 19ms between p50 and p99. The 170ms is almost certainly dominated by network round-trip to Helsinki, not app time.
If we want to disregard network latency and just test our Postgresql query, we can run this exact thing on our Hetzner box.

| Percentile | Latency |
|---|---|
| p50 (med) | 40.56ms |
| p95 | 57.86ms |
| p99 | 77.75ms |
Great! We saved about 120ms just from the round trip. Let’s profile our Postgres query to make extra sure.
docker compose exec postgres   psql -U "${POSTGRES_USER:-postgres}" urlshortener   -c "EXPLAIN ANALYZE SELECT original_url FROM urls WHERE slug = 'WY3Ly9Yd';"
                                                   QUERY PLAN
-----------------------------------------------------------------------------------------------------------------
 Bitmap Heap Scan on urls  (cost=4.14..8.15 rows=1 width=20) (actual time=0.029..0.030 rows=1 loops=1)
   Recheck Cond: (slug = 'WY3Ly9Yd'::text)
   Heap Blocks: exact=1
   ->  Bitmap Index Scan on slug_idx  (cost=0.00..4.14 rows=1 width=0) (actual time=0.012..0.012 rows=1 loops=1)
         Index Cond: (slug = 'WY3Ly9Yd'::text)
 Planning Time: 0.419 ms
 Execution Time: 0.091 ms
(7 rows)
The planning time is the time postgres took to optimize the query. The execution time is the time to actually execute the query.
The important thing isn’t the absolute numbers, it’s having them. Every subsequent phase will change something about the system and we’ll compare against this baseline.
The Postgres query takes 0.091ms to execute, so we can probably infer that Postgres is not the problem. The ~40ms on the VPS is the full request pipeline, which includes Caddy, Docker networking, Hono, connection pool to Postgres, etc.
What’s next
Phase 2 adds Redis. Every redirect currently hits Postgres, but a redirect is a pure read, and the slug-to-URL mapping almost never changes. It’s the ideal cache candidate. To reiterate, we are not trying to optimize speed of query — we already established that it is already sub-millisecond above. The purpose is to eliminate unnecessary queries.
But again, before we do any optimizations: measure, measure, measure. The baseline we establish here is the only honest way to know whether the next change actually helped.
You can’t manage what you don’t measure.
Disclaimer: I used AI to scaffold the implementation. All measurements, configuration decisions, and failure observations are from running this on a real VPS.